

QUANTITATIVE AND ELECTROPHORETIC ANALYSIS
OF COLLAGEN IN CULTURED FIBROBLASTS OF
TWO PATIENTS WITH A MILD TYPE I OF
OSTEOGENESIS IMPERFECTA DURING
TREATMENT WITH BISPHOSPHONATES
Kocova M1,*, Galicka A2, Woczyñski S3, Sukarova-Angelovska E1, Stefanovska I4
*Corresponding Author: Professor Dr. Mirjana Kocova, Pediatric Clinic, Faculty of Medicine, Vodnjanska 17, 1000 Skopje, Republic of Macedonia; Tel: +389-2-3111-713; Fax: +389-2-3176-167; E-mail: ozonunit@unet. com.mk
page: 13
|
|
RESULTS AND DISCUSSION
All fractures in P1 and P2 before introduction of therapy were treated conservatively. The clinical, laboratory and X- ray data are summarized in Table 1. There was an extremely good response to the therapy. After 2 months of therapy the parents of both children noticed that they became more active, probably because of the decrease of pain in the bones. After 26 and 18 months of therapy, respectively, neither patient had incurred any additional fractures, despite normal physical activity. Serum alkaline phosphatase activity decreased, and OSI was within normal range for the age.
Cultured skin fibroblasts of patients and control synthesized and secreted types I and III procollagens as shown in Fig. 1(A). However, in control fibroblasts, type III procollagen accounted for 5-7% of total collagen, whereas in the patients the levels of type III and type I procollagens were comparable. This may mean increased synthesis of type III or decreased synthesis of type I procollagen. In the type I OI, increased ratio of type III to type I procollagen usually results from half normal amount of type I procollagen caused by one "null" allele of COL1A1 gene encoding the proa1(I) chain, while the level of type III procollagen is normal [14]. However, collagen biosynthesis, measured by [3H]proline incorporation into proteins susceptible to the action of bacterial collagenase, in cells from both patients was comparable to the control (Fig. 2). When we loaded onto each slab the same amount of radioactivity incorporated into collagen, we noted a decreased level of type I collagen in OI fibroblasts with respect to control [Fig. 1(B)], while the level of type III collagen was markedly increased. If only normal collagen is produced by cells from our patients but in reduced amounts as in type I OI, the increased proportion of type III collagen may be a compensatory response to the low production of type I collagen. However, the control cells secreted about 50% of total collagen into the medium, whereas fibroblasts from the OI patients secreted less than the control by approximately 19 and 28%, respectively (Fig. 3). In addition, the amount of intracellular collagen increased in OI cells relative to the control fibroblasts. Secretion of non collagenous protein by the OI cells is also less efficient than by the control, which may suggest a more generalized transport defect in OI cells. However, in contrast to the control, the level of secreted collagen in OI medium is lower than that of non collagenous protein. This may indicate the presence of mutated collagen in cells and delayed secretion. The marker of mutated collagen is usually delayed electrophoretic migration of procollagen and/or collagen chains caused by their over modification [4,5], although a normal migration does not exclude the presence of structurally abnormal collagen. In both patients migration of secreted procollagen and collagen chains did not differ markedly from the control (Fig. 1). Faster migrating bands under a2(I) chains [Fig. 1(B)] were present in medium from both patients and control, but absent in the cell layers. To identify a molecular defect, analysis of DNA is needed.
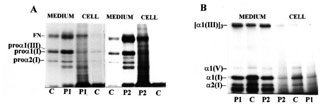
Figure 1. Sodium dodecyl sulphate (SDS)/polyacrylamide gel electrophoresis (PAGE) of procollagen (A) and collagen (B), synthesized and secreted into medium by the control (C) and OI patients (P1, P2) fibroblasts. Procollagens were separated in reducing, and collagens in non reducing conditions. Migration of procollagen and collagen chains and of fibronectin (FN) are indicated.
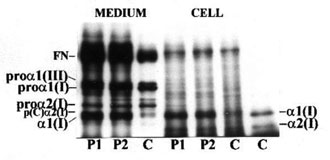
Figure 2. Collagen biosynthesis in the control (C) and patients (P1, P2) fibroblasts. Results are shown as combined values for cell plus medium fractions. Each value represents the mean for four independent experiments (repeated at different times from different passages of cells). The results were submitted to statistical analysis using the Students t-test, accepting p<0.05 as significant.
Figure 3. Distribution of collagen and non collagenous proteins in medium and cell layer. Results are shown as percent of total collagen (i.e., cells plus medium). Dotted bars show collagen and clear bars non collagenous proteins. Each value represents the mean for four independent experiments (repeated at different times from different passages of cells). The results were submitted to statistical analysis using the Students t-test, accepting p<0.05 as significant.
Clinically, both our patients had type I OI. Since in these patients the collagen level is reduced, but has normal structure, the aim of therapy is to increase biosynthesis of collagen. Our results that after 9 and 20 months of therapy, respectively, the level of synthesized collagen was comparable with the control. This finding can be a result of increased biosynthesis of collage III in the patients. However, the mechanism of this increase is not known. The therapy may have caused the increase of collagen through the influence of gene expression, or through activation of compensatory mechanisms. Therefore, the follow-up of collagen metabolism, before and during therapy with bisphosphonates, might be important in elucidating drug-gene interactions in patients with OI.
Table 1. Clinical data, laboratory and X-ray findings
|
Clinical information |
P1 (F-5.5) |
P2 (M-3.5) |
|
Family history |
No other members affected |
No other members affected |
|
Age when the child started walking alone |
14 months |
17 months |
|
First fracture |
4 years |
2.5 years |
|
Number of fractures during the last year before diagnosis |
3 |
3 |
|
Bones fractured |
Right tibia twice; right femur |
Right and left tibia; right femur |
|
Blue sclera |
[++] |
[++] |
|
Dentinogenesis imperfecta |
[+] |
[] |
|
Stature |
75 |
50 |
|
X-ray of limbs |
OI |
OI |
|
Ultrasound of kidneys |
Normal |
Normal |
|
Alkaline phosphatase (range: 63-82 U/L) |
229 U/L |
208 U/L |
|
Osteo-Sono assessment Index (OSI) |
<2SD |
<2SD |
|
Clinical diagnosis |
OI type I |
OI type I |
There are few data concerning the needed duration of bisphosphonate therapy in OI. More studies of collagen metabolism in different types of OI during therapy are needed in order to set up guidelines for the duration of the bisphosphonate therapy.
|
|
|
|

 |
Number 27
VOL. 27 (2), 2024 |
Number 27
VOL. 27 (1), 2024 |
Number 26
Number 26 VOL. 26(2), 2023 All in one |
Number 26
VOL. 26(2), 2023 |
Number 26
VOL. 26, 2023 Supplement |
Number 26
VOL. 26(1), 2023 |
Number 25
VOL. 25(2), 2022 |
Number 25
VOL. 25 (1), 2022 |
Number 24
VOL. 24(2), 2021 |
Number 24
VOL. 24(1), 2021 |
Number 23
VOL. 23(2), 2020 |
Number 22
VOL. 22(2), 2019 |
Number 22
VOL. 22(1), 2019 |
Number 22
VOL. 22, 2019 Supplement |
Number 21
VOL. 21(2), 2018 |
Number 21
VOL. 21 (1), 2018 |
Number 21
VOL. 21, 2018 Supplement |
Number 20
VOL. 20 (2), 2017 |
Number 20
VOL. 20 (1), 2017 |
Number 19
VOL. 19 (2), 2016 |
Number 19
VOL. 19 (1), 2016 |
Number 18
VOL. 18 (2), 2015 |
Number 18
VOL. 18 (1), 2015 |
Number 17
VOL. 17 (2), 2014 |
Number 17
VOL. 17 (1), 2014 |
Number 16
VOL. 16 (2), 2013 |
Number 16
VOL. 16 (1), 2013 |
Number 15
VOL. 15 (2), 2012 |
Number 15
VOL. 15, 2012 Supplement |
Number 15
Vol. 15 (1), 2012 |
Number 14
14 - Vol. 14 (2), 2011 |
Number 14
The 9th Balkan Congress of Medical Genetics |
Number 14
14 - Vol. 14 (1), 2011 |
Number 13
Vol. 13 (2), 2010 |
Number 13
Vol.13 (1), 2010 |
Number 12
Vol.12 (2), 2009 |
Number 12
Vol.12 (1), 2009 |
Number 11
Vol.11 (2),2008 |
Number 11
Vol.11 (1),2008 |
Number 10
Vol.10 (2), 2007 |
Number 10
10 (1),2007 |
Number 9
1&2, 2006 |
Number 9
3&4, 2006 |
Number 8
1&2, 2005 |
Number 8
3&4, 2004 |
Number 7
1&2, 2004 |
Number 6
3&4, 2003 |
Number 6
1&2, 2003 |
Number 5
3&4, 2002 |
Number 5
1&2, 2002 |
Number 4
Vol.3 (4), 2000 |
Number 4
Vol.2 (4), 1999 |
Number 4
Vol.1 (4), 1998 |
Number 4
3&4, 2001 |
Number 4
1&2, 2001 |
Number 3
Vol.3 (3), 2000 |
Number 3
Vol.2 (3), 1999 |
Number 3
Vol.1 (3), 1998 |
Number 2
Vol.3(2), 2000 |
Number 2
Vol.1 (2), 1998 |
Number 2
Vol.2 (2), 1999 |
Number 1
Vol.3 (1), 2000 |
Number 1
Vol.2 (1), 1999 |
Number 1
Vol.1 (1), 1998 |
|
|